


Every election season, I’m bombarded with calls from candidates and campaign managers who want to convince me that, despite what the maps and the polls say, THIS YEAR they are going to flip their district. They’re working harder. They’re raising more money. They’re knocking on doors. They have Republicans promising to vote for them. Yet, almost every year, those promises fall flat.
It isn’t for lack of effort or passion. Most of the time, it’s the gerrymandering or the billionaire fascists hosing money into their opponent’s race. But there’s something different about this year. I can feel it in my gut. I can feel it in my bones. And I’m looking around at my beloved state, and it seems like people are waking up. This time, I don’t think it’s my echo chamber.
Let’s start with the numbers.
Civiqs has been tracking this since the day Trump took the oath, and as of late July, Trump’s net approval in Texas sits at -13. Texas is one of eleven states Trump carried by double digits in 2024 where he’s now underwater, in the “should have been safe but isn’t” column.
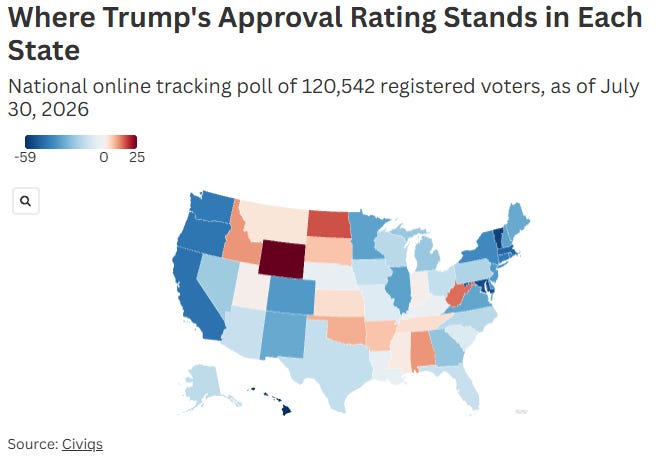
Then there’s The Economist and YouGov, who ran their own state-by-state model in late August and found something even uglier. Trump is underwater in 47 out of 50 states, and Texas is sitting at -22. Nationally, the two outfits aren’t even measuring the same planet. Civiqs has him at -24. YouGov has him worse, at -26.
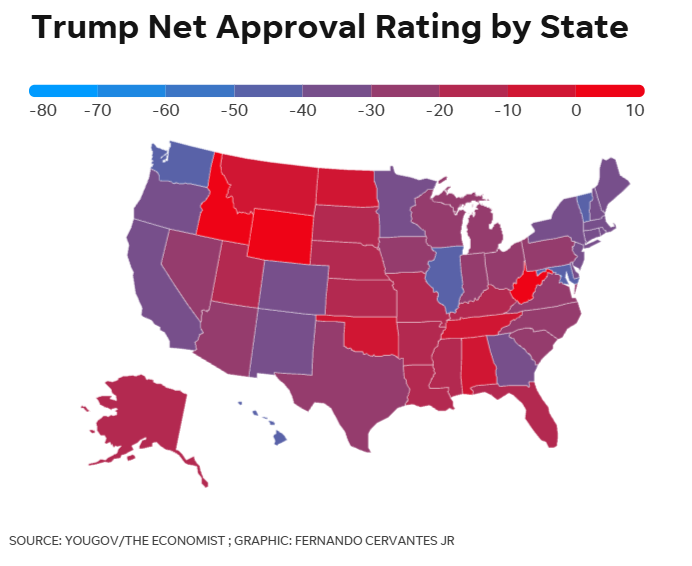
Different methods, different assumptions, nine points apart on the same state in the same month. When two outfits looking at the same guy in the same state come back nine points apart, the honest read is “something in Texas is genuinely unstable right now.”
The August 21 to 24 Economist/YouGov poll has Democrats up 6 points nationally among registered voters, 46 to 40. But break it down further and something interesting happens. Among the voters who say they will definitely show up in November, that lead balloons to 12 points, 52 to 40. That’s the group actually likely to cast a ballot, and Democrats are cleaning up with them.
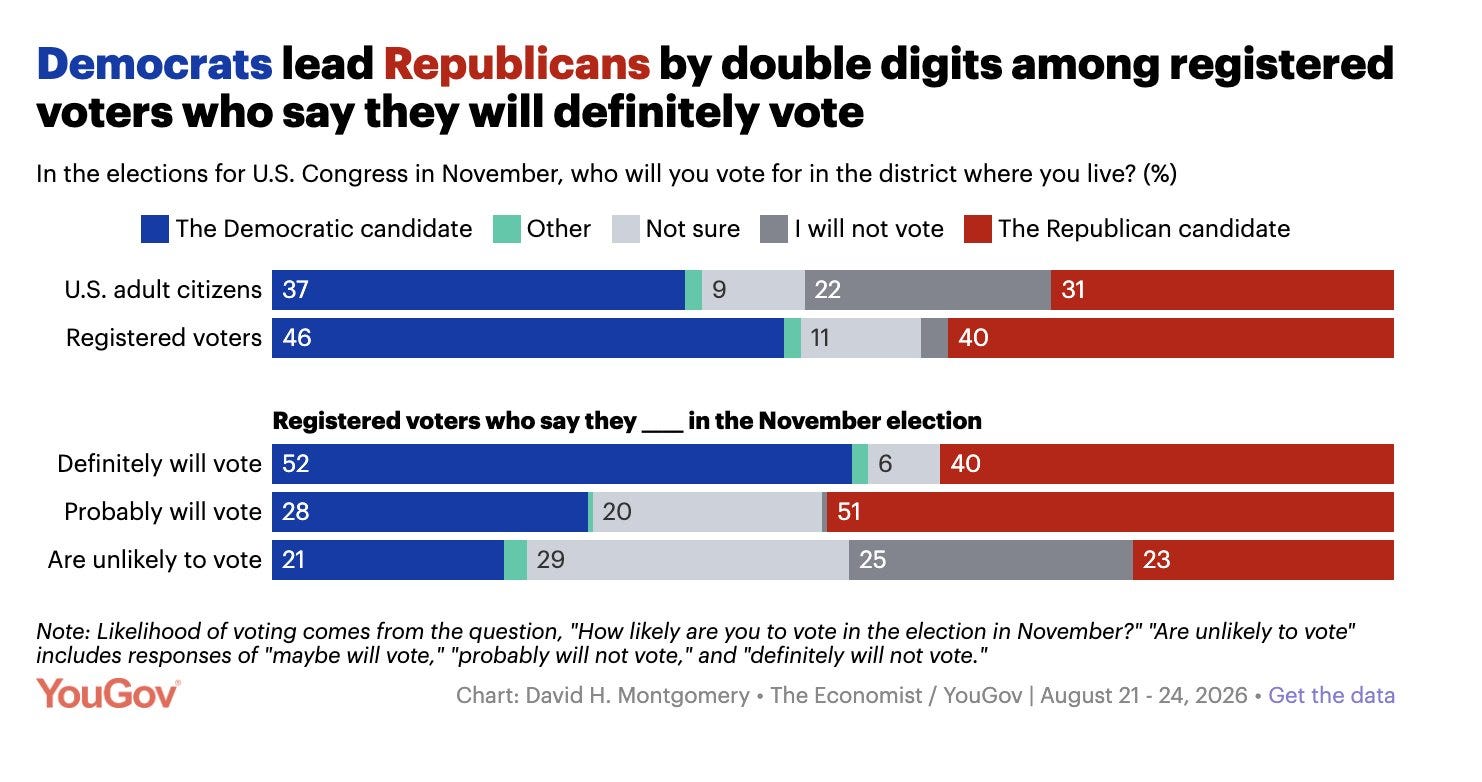
What does this mean?
It means the wave, if it’s coming, depends entirely on whether the definite voters actually show up in the numbers they’re promising, and whether the probably voters, who are currently leaning hard red, stay home like they say they might. Pollsters have been burned before betting on turnout models. It’s a real Democratic advantage sitting right next to an asterisk.
Statewide movement.
While all that’s playing out, the Cook Political Report repriced the whole state. On August 20, Cook moved the U.S. Senate race between Ken Paxton and James Talarico from “Leans Republican” to a flat-out Toss-up. They moved the governor’s race between Greg Abbott and Gina Hinojosa from “Solid Republican,” meaning don’t even bother watching it, to “Likely Republican,” meaning watch it.
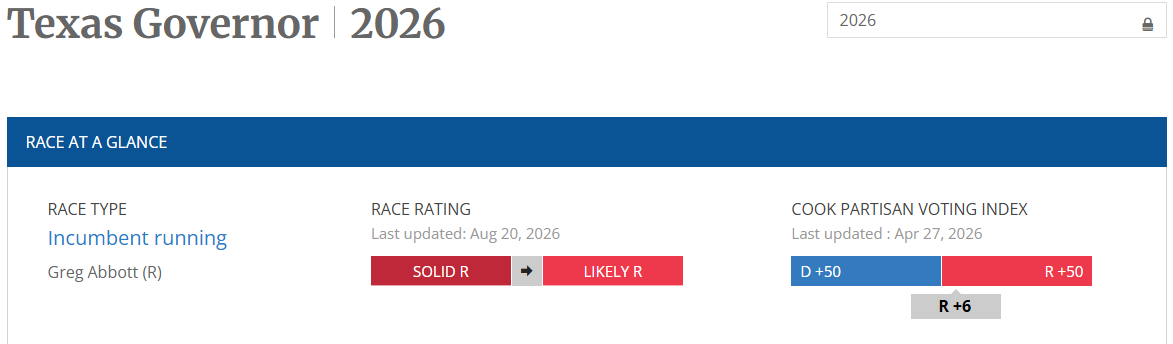
Here’s what’s underneath it:


Money’s telling the same story. Talarico has outraised Paxton by more than $60 million so far and had to refund over a million dollars in excess contributions because people kept sending him money he wasn’t legally allowed to keep. Trump has personally promised to help Paxton close the gap, which tells you the national party sees the same hole in the boat I do.

Now, we’ve been here before. In 2018, Beto O’Rourke ran the most expensive, most energetic Senate campaign this state had seen in a generation, got Texans talking about a “blue wave,” and still lost to Ted Cruz by 2.6 points. But that near miss did something else. It flipped state legislative seats up and down the ballot. Keep that in your back pocket, because it matters for what comes next.
The expected flips.
Remember when Republicans did their mid-decade redistricting, and on several occasions I spoke about how stupid they were drawing the maps, because instead of basing the districts on the census numbers, they based them on Trump’s 2024 win numbers? It still cracks me up.

This is how Republicans gave themselves a “dummymander,” and instead of “gaining five seats,” as Trump told them to, they will lose two, five, seven, really there’s no telling at this point, but they will lose.
TX15: Bobby Pulido is beating Monica De La Cruz. 50 to 45. Pulido is ahead. Cook Political Report is still calling this district “Lean R” as of August 13, which means Cook’s rating is now five days older than a poll that says Cook’s rating is wrong. That gap, between what the forecaster says and what the voters say, is the whole story of this district right now.
TX28: Henry Cuellar is up eleven on Tano Tijerina, 45 to 34. Sounds comfortable. It isn’t. Only 69% of Democrats in that district say they’re actually voting for Cuellar. Fifteen percent are still undecided. This is a man who has represented this seat for over two decades, and he can’t lock down his own party. The lean-district math everybody’s been using, which had him sitting pretty at D+23, was wrong. The real number is half that.
TX34: Vicente Gonzalez is up three on Eric Flores. 45 to 42. That’s a coin flip with a slight thumb on the scale, and it’s exactly how Cook and Inside Elections already have it rated. Toss Up.
Look at how far each of these districts has moved since the top of the ticket ran through them:

TX15 moved twenty-three points in two years.
Now, before anybody gets too excited about the “Hispanic realignment reversal is here,” I want to point out something. TX34 has the smallest swing of the three, thirteen points, and it’s not because the voters there care less about Trump. It’s the candidates. Look at the favorability numbers underneath these races. In TX-15, Pulido’s net favorability is positive eleven. De La Cruz is net negative two.
In TX34, both Gonzalez and Flores are sitting at net negative one and negative two, essentially tied, nobody particularly liked by anybody, and the swing there is the smallest of the three. We have to get Vicente Gonzalez re-elected this year (as much as he sucks), and then plan another primary against him in 2028. The other guy wants to starve babies.
The surprises.
Trust me for a minute, because I’m about to walk you through some math that gets less impressive the closer you look at it, and I think that’s actually the honest and useful version of this story.
Taylor Rehmet, a first-time candidate, ran for a Tarrant County state Senate seat that Trump carried by 17 points in 2024. Rehmet won the special election runoff 57 to 42. Do that math yourself, and it’s a 15-point win. You’ll see it reported around as “14%,” both by The Texan and Wikipedia. I’m going with the actual vote count over the rounded-down headline number every time.
Trump plus 17 to Rehmet plus 15 is a 32-point swing in one district. That number went viral for a reason. It’s a hell of a number. But before you go pasting it onto every district on the map, I want to walk you through why that’s not how any of this works.
There isn’t one swing number out of SD09. There are two, and they’re measuring different things:

Both of those numbers are true. Neither one is “the” SD09 swing, because they’re not measuring the same thing against the same baseline. Anyone who flattens this into one clean number is picking the flashier one.
If you take the full 32-point district-wide swing and slap it evenly across all 38 congressional districts, you know what happens?
Thirty-five of them flip Democratic. Thirty-five. Out of thirty-eight. Only TX-1, TX-13, and TX-19 survive.
If you believe that’s what’s actually about to happen in November, I have several bridges to sell you, and one of them is in El Paso.
What I did wrong, and what everybody sharing that tweet is doing wrong, is treating SD09 like a uniform statewide event instead of a story about Latino voters specifically, in one specific place. So instead, weight the swing by how Hispanic each district actually is. Scale that 26-point Hispanic vote shift by each district’s Hispanic voting-age population, leave everything else where it sits, and you get something like this:

I left TX9 off that list on purpose, because I got this one wrong in an earlier draft of my own thinking. TX9 has a big Hispanic population (58.6%), and on paper it looks like the juiciest reach seat on the board. But Cook’s own redistricting analysis has the new lines at Trump plus 20. That’s a district Republicans built specifically to be safe, and no single special election’s worth of momentum closes a 20-point gap. TX9 isn’t a surprise seat. TX23 and TX35 are the real ones, and since both have been added to the DCCC list, we will likely see them flip in November.
One more thing. SD09 is a Tarrant County suburban and urban district covering Fort Worth, Keller, and North Richland Hills. It is not the Rio Grande Valley. Rehmet also won as a massive underdog, got outspent 12 to 1, and still won by 15 in a low-turnout special election runoff where the only thing on the ballot was his race. That’s a different electorate, a different turnout universe, and a different kind of election than a November general with a governor, a senator, and every congressional seat on the same ballot. I think the Latino swing in SD09 is real, and it’s telling us something true about where this state is headed. TX23 and TX35 earn their spot on this list because the district-specific math backs them up, not because one special election three hundred miles away got everybody excited.
Could election forecasters still be behind?
I don’t think Cook’s “Lean R” tag on TX15 is the last word on that district.
Cook Political Report does its job well. This isn’t a “the establishment forecasters don’t get it” rant. A political scientist at SUNY Buffalo went back through forty years of their ratings and found that when Cook calls a race “Solid,” they’re right 99.9% of the time. “Likely,” they’re right 97% of the time.
But look what happens to that accuracy the further down the confidence scale you go, and specifically, look what happens to ratings made at exactly the point in the cycle we’re sitting in right now:

Ratings Cook publishes in July and August, before Labor Day, before the fall campaign really kicks into gear, before people are actually paying attention, hold up 85.7% of the time. And we already have a live poll from five days after that rating showing the exact race it’s supposed to describe going the other direction.
I’m not asking you to believe Cook is bad at this. I’m asking you to believe the calendar. A rating made in August carries a real, measurable, published chance of being stale by November, and TX15 is exactly the kind of call that historically doesn’t survive the fall.
Look at where they had TX23 and TX35 in June versus where they are now. In June, both districts were sitting in the “Likely” tier. By August, both had moved into Cook’s competitive bucket, toss-up or lean territory. That’s their own analysts moving their own ratings.
Cook’s own analysis of past cycles shows that when a president’s approval is declining through the summer, the way it declined in 2006, 2010, and 2018, their ratings keep moving against that president’s party all the way through the fall. It keeps sliding until Election Day. Trump’s approval has been sliding since spring. If the historical pattern holds, that means the ratings we’re looking at today- Lean R on TX15, Toss Up on TX34, competitive-but-not-official on TX23 and TX35- are not the final word. They’re a snapshot of a trend that, if 2006, 2010, and 2018 are any guide, isn’t done moving yet.
How do we confirm all of this?
Magic8Ball! Not yet.
Here’s exactly what I’m watching, and exactly what would tell us if this is wrong.

Q3 fundraising lands October 15; money doesn’t lie about enthusiasm.
Cook not moving TX15 before Labor Day would actually be a real data point, and not the one you’d think. It wouldn’t necessarily mean I’m wrong. It might mean Cook doesn’t trust a single academic poll enough to move a rating on it alone, which is a reasonable, boring, professional thing for them to do. But if a second poll comes in agreeing with TSU and Cook still hasn’t moved, that’s when I start asking harder questions about why a forecaster with an 85.7 percent track record at this exact point in the cycle is sitting on a rating five points of live data disagree with.
And TX23 is the one I’d tell you to watch most closely, because it’s the cleanest test. It’s the other true border seat. Nobody’s polled it yet, as far as I can find. If somebody does, and the Hispanic-weighted swing model I walked you through holds up in an actual district that isn’t SD09, that’s the moment this stops being an interesting theory and starts being a pattern with a second data point behind it.
I don’t know how this ends. Nobody does. What I know is that the maps say one thing, the polls are starting to say another, and for the first time in longer than I can remember, the gap between those two things is working in our favor instead of against it. Keep your popcorn ready.
69 days until the November election!
Did you know you can find links to all the previous Meet the Candidate articles on these lists?:
Click here to find out what Legislative districts you’re in.
I am slightly optimistic! I would be more impressed if the rug hadn’t been yanked on me before!
I disagree on TX9, things are heating up and 69 days is a lot of time for things to sway. Based on what I'm seeing, everything is moving in the right direction. I think that one will be a surprise hold for us. I respect Cook, but there is only so much data you can gather from an area, especially an area averse to taking polls. I'm not expecting a blow out, but it will be much closer than polling and Cook suggests. I expect a 1-2 point win by Gutierrez.